
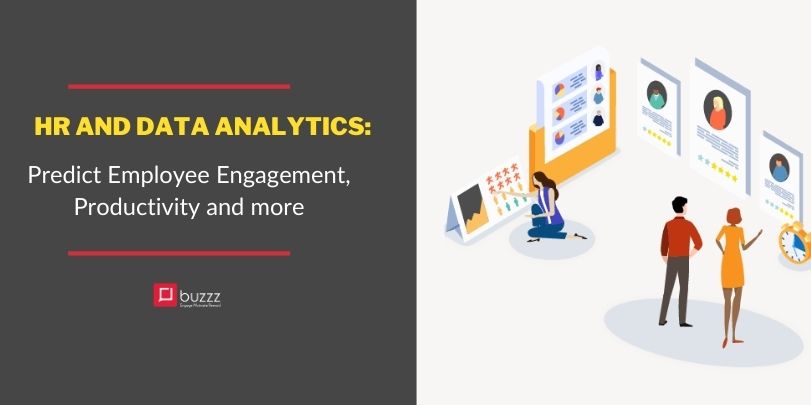
HR and Data Analytics: Predict Employee Engagement, Productivity and more
The day may come when a key employee will tell you that they plan to leave the company. This situation is typical, however knowing this in advance and taking precautions beforehand to retain your best employee would be extraordinary. Right?
Want to know how? With data analytics!
Today, every modern business is data-driven, and the vital role of data is to empower business leaders and help them make decisions based on trends, facts, and statistical numbers. With comprehensive data now available, leaders must shift through the noise and focus on the right information to help them make the best decisions related to strategy and growth.
Data has become the core of every business decision and different departments utilize data in different ways. A Sales department uses past data to analyze and set goals, understand customers’ lifetime value, get the pricing right, etc. A marketing department is zooming in on market segmentation data to find out the right market, correct audience, what drives consumers to take action, etc.
Likewise, over the past few years, Human Resource Management (HRM) has also adopted a data-driven & strategic approach from an operational one. One of the best advantages of using people analytics is that you don’t rely on gut feeling anymore. It helps the HR test the effectiveness of the policies, employee engagement, and different interventions.
How HR can simplify their tasks with Analytics
People analytics analyzes employee-related data using metrics and tools to learn employee patterns, evaluate their behavior, find least engaged employees, evaluate workplace culture adoption, accumulate feedback, and also indicate signs that could lead to employee turnover. For example, an unwanted and measurable behavior like high absenteeism where an employee is absent for unnecessary reasons calls for some evaluation.
Dr. Mark Huselid, a distinguished Professor of Workforce Analytics, highlights that the real goal of HR analytics activities is to understand, quantify, manage, and improve the strategy and value creation. It demands data collection from various internal and external sources, processing it, storing and analyzing it to get valuable insights related to employees whose commitment helps bring out the organization’s performance. This data allows a manager to make informed decisions about various aspects of the employee lifecycle like training, performance evaluation, compensation, and growth.
There are various tools available to capture data that can help HR. One such platform is Buzzz, an employee engagement and recognition platform that works as a catalyst in increasing engagement and empowering businesses to drive meaningful change in the culture and the bottom-line business metrics.
Buzzz captures these three parameters to help HR predict employee behavior and take actions proactively:
1. Employee Engagement
Employee engagement is a driving factor to attract and retain talent. It acts as a direct link with corporate performance. It is the emotional connection that employees experience which leads to a willingness to use discretion at work. Employee engagement must be part of a corporate strategy that focuses on finding dedicated employees and then engaging them throughout the working relationship.
Four common ways of measuring employee engagement are:
- Annual engagement surveys: A traditional yet popular way of gauging employee engagement, these annual surveys are conducted once a year. HR can use these surveys to understand and hold as a benchmark to measure employee engagement. As these surveys are distributed only once, it tends to be lengthy as HR asks all the questions in one survey. However, this annual survey can be misleading as the feedback over a vast span of time cannot be accurate and might be driven by an employees’ mood for the day or biased based on a recent incident.
- Pulse surveys: Compared to annual surveys, these surveys are distributed more frequently to track the employees’ real-time views and opinions. These are conducted on a quarterly, monthly, or even weekly basis. HR leaders compare the pulse surveys data to their annual surveys data to gauge their progress in detail.
- Stay interviews: Alternative to exit interviews, HR leaders and managers schedule one-on-meetings with highly valued employees to take their feedback and find out about their big career goals, what they enjoy about their work, things they wish to change at the workplace, etc. This helps in customizing growth plans for high performing individuals and provides great insight for making futuristic manpower plans.
- Turnover rate: It measures the number of employees leaving the organization over a defined period. A high turnover rate highlights a low level of engagement.
Though every way mentioned above has some advantages, today, it is becoming crucial to conduct a daily survey that is more accurate and useful. With Buzzz, organizations can track their staff’s daily engagement on the platform that captures their everyday mood, a recognition given and received, interaction on the platform, certificates earned, and more. Refer to the image 1.1 below.

Image 1.1
In image 1.2, the daily/weekly/monthly summary offers HR leaders an overview of the engagement trend and statistics. Leaders can view the data for all departments together or track each department individually.

Image 1.2

Image 1.3
The above image 1.3 represents the data of employees of all departments with their happiness index and engagement index. Organizations can draw a benchmark for every data and take actions when it reaches below the desired performance level.
2. Organizational Behaviour
Every Organization has certain behaviors that they want to cascade amongst its employees. For example, going the extra mile, collaboration, teamwork, being professional, etc.
Consider, an organization with 4-5 behaviors that they want their employees to reflect. Still, nearly everyone displays only one kind of behavior, then there is a clear disconnect and mismatch of expectations between the employees and the organization.

Image 2.1
With Buzzz, managers can socially recognize their teams for displaying a particular behavior as you can see in the image 2.1 above. With this data, HR’s and management can track the organization pulse and see how many employees are blending well into the company culture. It can be a great input for the organization training and development strategy.
3. Happiness index
How you are feeling on the inside can have a significant impact on your day at work. Wouldn’t you agree? Research also confirms that our feelings have a huge influence on our decision-making, and yet often, at that moment, we aren’t aware of how we’re feeling or how those feelings are influencing our behaviors.
The Buzzz Mood-o- Meter is designed to help employees learn to recognize emotions. By way of simple worlds, it provides the employees with a “language” to talk about their feelings.
If you want to build an organization powered by winning work culture, it is essential to understand how your employees feel.
Buzzz allows the organization to conduct a survey and offers reports and dashboard that can be broken down department wise and can be narrowed down to individual employee level. One of the most significant advantages of Buzzz Mood-o-Meter survey is that the platform asks employees about ‘how’ their mood is for the day and also asks them ‘why’ their mood is the way it is today. Employees can fill in the survey and choose to be Anonymous while submitting their feedback, which gives employees the freedom, to be honest without revealing their names. Through the dashboard, HR can track the various reasons indicated by employees about their moods, enabling HR to proactively develop strategies to counter low employee morale.

Image 3.1
As seen in the image 3.1 above, 22.6% of employees said they are sad due to work-life balance. HR and team leaders can look at such data and arrive at simple solutions or policy changes to create a happy workplace. Likewise, they can work in each area, which displays their employees are sad and unhappy.
With these reports, HR leaders can analyze the various reasons and also choose to conduct one-on-one sessions with the least engaged employees. The bottom line is, today, listening to employees directly and taking quick actions can positively impact employee productivity and reduce employee turnover.
Organization decision-makers, being the management and HR, need to consider both the available data and contextual facts before planning and implementing any action plan. While making a decision, gut and context must be combined with data to improve corporate performance. Remember that humans can create the best machines, but it cannot control the great humans. Therefore, instincts hold the same amount of significance as data and can make a massive difference between success and failure. Consequently, having data to support your instincts can go a long way in making timely decisions.
Take your employee engagement to the next level by knowing how your employees are engaging with the company and other team members, understand how they are feeling, what encourages them, when are they happy, when is the correct time to motivate them and more. Buzzz not only captures all these analytics for you but also prompts you when any action is required. To know more about how you can utilize Buzzz features and dashboard- book a demo.